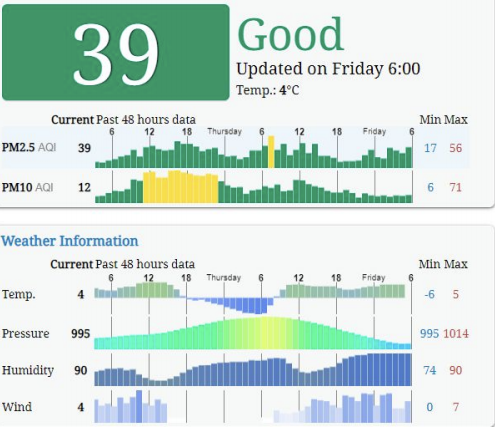
Sustainability Mirror for European Cities
A team of 5 students, in cooperation with a large national energy provider, worked on a dashboard for various sustainability metrics for cities, making available data for air pollution, urbanization, renewable energy production and more. They combined multiple open data sources which are available for most major cities to provide metrics that are comparable across cities and can be updated automatically.
Energy Consumption Prediction Challenge
A team worked on the Energy Consumption Prediction Challenge and built a well-performing model along with an analytics dashboard that lets users predict energy for custom buildings. Github Page. In the second phase of the project the team built a webpage that allows users to predict the energy consumption of their buildings based on the model from the challenge.
IASS Social Sustainability Barometer
Another team built an interactive dashboard for the investigation of results from the IASS Social Sustainability Barometer in collaboration with the Institute for Advanced Sustainability Studies in Potsdam, Germany. The dashboard, built with R and shiny, shows the results of the social sustainability survey geographically and over time.
mlr3forecasting: Time Series Forecasting with Machine Learning
Students developed mlr3forecasting, an R package for time series forecasting with machine learning. Its goal is to facilitate time series forecasting, e.g., predicting global temperatures. It extends the popular machine learning framework mlr3.
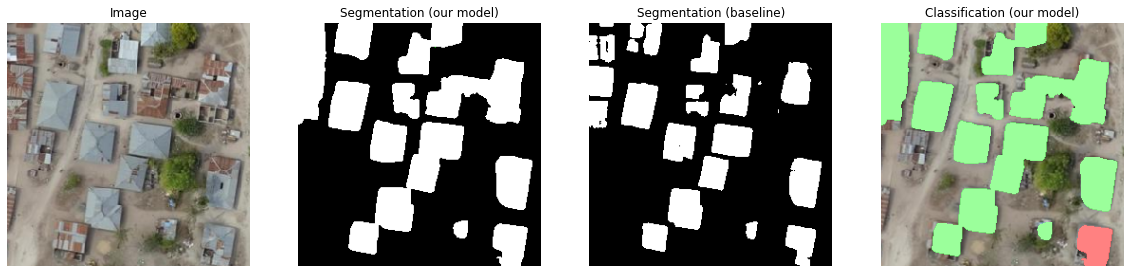
Disaster Prediction Challenge
Students trained deep neural network models for the xview 2 disaster prediction challenge. The challenge’s goal is to find and localize damage from natural disasters on satellite images. The students built a model based on a U-Net architecture with a ResNet backbone and adaptive loss functions that was able to classify and localize damage types.