Automatic statistician for exploratory data analysis
In this project, the student team developed an R package AEDA that automatically analyzes data, streamlining manual steps of exploratory data analysis. A wide range of common tasks of data scientists is automated with this package: Basic data summaries, correlation analysis, cluster analysis, principal component analysis and more. All results are automatically compiled to a report.
Explaining machine learning predictions with game theory
In this project, the students developed an R package ShapleyR that implements Shapley values for explaining machine learning predictions. Shapley values are a method from game theory, which can also be used to understand the decision making of machine learning models better.
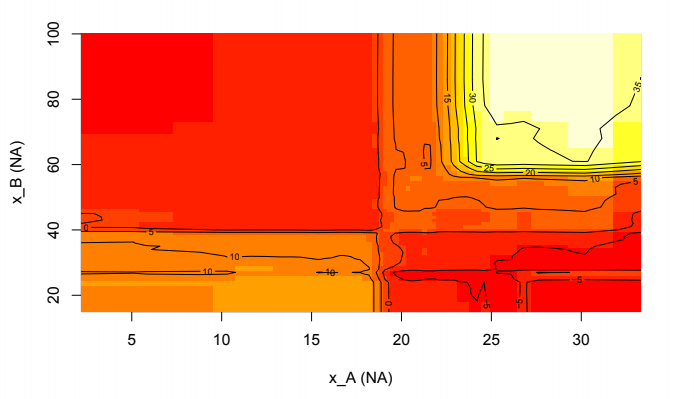
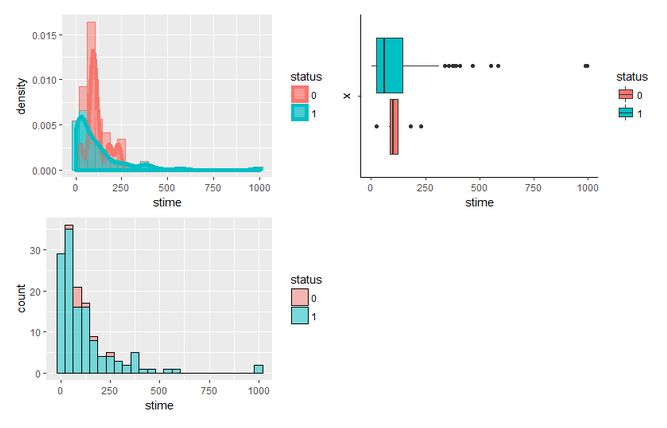
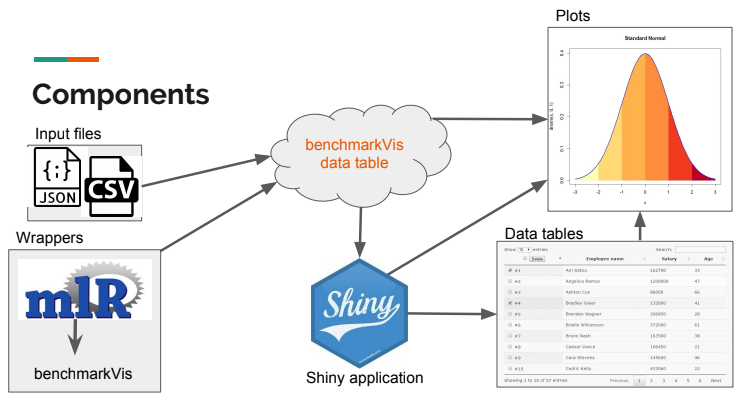
Interactive plots and tables for benchmarking results
The students developed an R package ‘benchmarkViz’ for comparing the results of benchmark studies. The project involved proposing a standard format in which arbitrary benchmark results, be it run time of algorithms or the performance of machine learning models, can be encoded and easily visualized.
Interactive plots for interpretation of global and local effects
The students implemented a dashboard for explaining machine learning models. The dashboard allows users to upload a model and automatically visualize it with different types of plots.